Seattle vs Eastside: 2025 Real Estate Price Comparison for Tech Workers
Seattle vs Eastside: 2025 Real Estate Price Comparison for Tech Workers
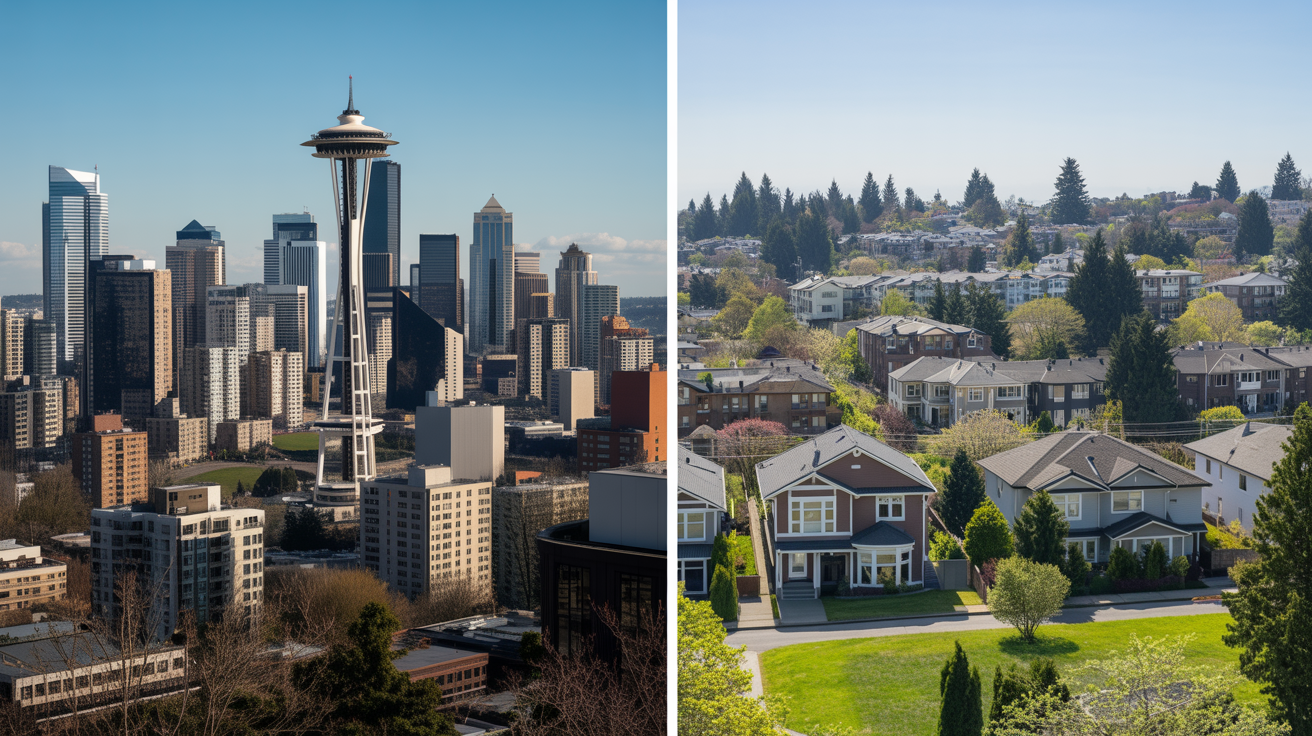
As a tech professional in the Puget Sound region, one of the most consequential decisions you'll make is choosing between Seattle's urban core and the Eastside's suburban tech corridor. This choice impacts not just your daily commute and lifestyle, but also represents a significant financial commitment that will shape your wealth-building trajectory for years to come.
In 2025, the price gap between Seattle and the Eastside has widened to historic levels, with median home prices on the Eastside reaching $1.6 million compared to Seattle's $985,000. Yet the decision isn't simply about affordability—it's about understanding the total value proposition each region offers in terms of property appreciation, cost of living, commute times, school quality, and lifestyle amenities.
This comprehensive analysis provides tech workers with the data-driven insights needed to make an informed decision. Whether you're a Microsoft engineer evaluating Redmond vs. Fremont, an Amazon employee comparing Capitol Hill to Bellevue, or a Google product manager weighing Kirkland against Ballard, this guide breaks down every factor that should influence your choice.
The Price Divide: Understanding the Numbers
Median Home Price Comparison
The most striking difference between Seattle and the Eastside is the sheer magnitude of the price gap. Throughout 2025, this disparity remained consistent and significant:
Eastside Median Prices (2025):
- Q1 2025: $1,680,000 (5% year-over-year increase)
- March 2025: $1,710,000
- September 2025: $1,575,000
- Year-end 2025: $1,599,000
Seattle Median Prices (2025):
- Q1 2025: $960,000 (6% year-over-year increase)
- March 2025: $1,000,000 (crossed the million-dollar threshold)
- September 2025: $975,000
- Year-end 2025: $985,000 (5% annual increase)
The Bottom Line: The Eastside commands a premium of approximately $614,000 (62%) over Seattle's median home price. This represents a $280,000 increase from the Eastside's market low of $1.4 million in early 2023.
City-by-City Breakdown
Eastside Cities (September 2025 Median Prices):
- Bellevue: $1,524,000 (early 2025 data showed $2,240,788 for premium areas)
- Sammamish: $1,600,000
- Kirkland: $1,300,000
- Redmond: $1,220,000
- Issaquah: $1,113,860
Seattle Neighborhoods (2025 Price Ranges):
- Queen Anne: $1,080,000 - $1,450,000
- Wallingford: $1,110,000 (average)
- Ballard: $846,000 - $975,000
- Capitol Hill: $615,000 - $820,000
- Fremont: $900,000 - $1,100,000
Key Insight: Even the most affordable Eastside city (Redmond at $1.22 million) is more expensive than Seattle's priciest neighborhood (Queen Anne at $1.45 million). This reflects the Eastside's consistent premium across all submarkets.
Condominium Market Comparison
The condo market tells a similar story, though with a smaller price gap:
2025 Condo Median Prices:
- Eastside: $735,000 (Q1 2025, 9% year-over-year increase)
- Seattle: $635,000 (Q1 2025, 15% year-over-year increase)
- Combined Market: $630,000 (2% annual increase)
What This Means: Seattle's condo market saw stronger percentage growth (15% vs. 9%), suggesting robust demand for urban living. However, the Eastside still commands a $100,000 premium even for condos, reflecting the value placed on Eastside school districts and suburban amenities.
Price Per Square Foot: The True Value Metric
Price per square foot provides the clearest picture of relative value between the two regions:
2025 Average Price Per Square Foot:
- Eastside Single-Family: $699/sq ft (4% increase from 2024)
- Seattle Single-Family: $580/sq ft (2% increase from 2024)
- Eastside Condos: $643/sq ft
- Seattle Condos: ~$620/sq ft (implied from combined average)
- Mercer Island (Premium): $895/sq ft
The Gap: The Eastside commands a $119/sq ft premium over Seattle for single-family homes. On a 2,500 sq ft home, this translates to nearly $300,000 in additional cost.
What You're Paying For: This premium reflects:
- Top-rated school districts (Bellevue, Lake Washington, Northshore)
- Proximity to major tech employers (Microsoft, Google, Meta)
- Newer housing stock with modern amenities
- Lower crime rates and perceived safety
- Larger lot sizes and more outdoor space
For more insights on navigating competitive markets, check out our guide on how to win bidding wars in Seattle's competitive market.
Market Dynamics: Inventory, Competition, and Sales Pace
Inventory Levels: More Choices in 2025
Both regions saw significant inventory increases in 2025, providing buyers with more options than in previous years:
Eastside Inventory Growth:
- New listings increased 16% for the year
- March 2025 inventory up 86% year-over-year
- September 2025: 60.3% more homes on market than previous year
- Months of supply: 2.79 months (still a seller's market)
Seattle Inventory Growth:
- New listings increased 12% for the year
- March 2025 inventory up 31% year-over-year
- Months of supply: 3.08 months (September 2025, up from 2.25 months)
Market Interpretation: While both markets remain seller-friendly (under 4 months of supply), the increased inventory has shifted power slightly toward buyers. Seattle's higher months of supply (3.08 vs. 2.79) suggests marginally more negotiating leverage for buyers compared to the Eastside.
Sales Pace: How Fast Homes Sell
Despite increased inventory, both markets remained highly competitive throughout 2025:
Eastside Sales Metrics:
- 53% of homes sold within first 10 days (full year)
- March 2025: 80% sold within 15 days
- 53% sold for more than asking price (March)
- 55% sold at or above list price (full year)
Seattle Sales Metrics:
- 55% of homes sold within first 10 days (full year)
- March 2025: 71% sold within two weeks
- 64% sold at or above list price (full year)
Surprising Finding: Seattle's market was slightly more competitive than the Eastside in 2025, with 64% of homes selling at or above list price compared to 55% on the Eastside. This likely reflects Seattle's more accessible price point, which expands the buyer pool and intensifies competition.
Property Type Availability
Seattle Strengths:
- Abundant condo inventory in urban cores (Belltown, South Lake Union, Capitol Hill)
- Townhomes in transitional neighborhoods
- Single-family homes in residential areas (Ballard, Magnolia, Green Lake)
- More diverse housing stock overall
Eastside Strengths:
- Dominated by single-family homes
- Newer construction with modern amenities
- Larger lot sizes (typically 7,000-15,000 sq ft)
- Limited but growing townhome developments
- Fewer condos, mostly concentrated in downtown Bellevue
For Tech Workers: If you're seeking a single-family home with a yard, the Eastside offers more options despite higher prices. If you prefer urban condo living or need a more affordable entry point, Seattle provides significantly more inventory.
Appreciation Trends: Where Your Investment Will Grow
Historical Performance (2023-2025)
Eastside Appreciation:
- 2023 low: $1,400,000
- 2024 peak: $1,600,000 (14% increase in Q1 2024)
- 2025: Held flat at $1,599,000 (stabilization at high plateau)
- Total 2023-2025 gain: $199,000 (14.2%)
Seattle Appreciation:
- 2023-2024: Recovery from pandemic-era volatility
- 2025: 5% annual increase to $985,000
- Crossed $1 million threshold in March 2025
Key Takeaway: The Eastside experienced explosive growth in 2023-2024 and has now stabilized at a high level. Seattle showed steadier, more moderate growth throughout the period.
2026 Forecast and Beyond
Regional Outlook:
- Seattle-Tacoma-Bellevue metro: +0.1% (effectively flat)
- Market entering "Great Housing Reset" period
- Stabilization rather than boom or bust
Eastside Specific Projections:
- Moderate growth: 3-5% annually
- Bellevue: Potentially 5-7% due to low inventory and corporate expansion
- Driven by: Tech sector stability, school district demand, limited supply
Seattle Specific Projections:
- Aligned with flat regional forecast
- Potential for 2-3% growth in premium neighborhoods
- Constrained by affordability ceiling
Investment Perspective: The Eastside offers stronger appreciation potential but requires significantly more capital. Seattle provides more accessible entry with moderate appreciation. Both markets are protected from significant downturns by:
- Strong economic fundamentals
- Limited developable land (geographic constraints)
- Substantial homeowner equity (reduces panic selling risk)
- Stable mortgage rates (expected to remain around 6%)
For company-specific guidance, explore our guides for Amazon employees, Microsoft employees, and Google employees.
Cost of Living: Beyond the Purchase Price
Property Taxes: A Surprising Advantage for Bellevue
2025 Property Tax Rates (per $1,000 of assessed value):
- Seattle: $9.19418 (8% higher than King County average)
- Bellevue: $8.50474
Annual Tax Comparison on $1,000,000 Home:
- Seattle: $9,194
- Bellevue: $8,505
- Savings in Bellevue: $689/year
On $1,500,000 Home:
- Seattle: $13,791
- Bellevue: $12,757
- Savings in Bellevue: $1,034/year
Why the Difference: Seattle voters approved additional levies, including a transportation lid lift, that increased the city's rate. Despite higher home values, Bellevue residents pay lower tax rates.
Utility Costs
Monthly Utility Comparison (One-Bedroom Equivalent):
- Seattle: ~$150/month
- Bellevue: ~$180/month
Electricity Costs (2025 Average Monthly Bill):
- Seattle: $84.22 (served by Seattle City Light)
- Bellevue: $126.41 (served by Puget Sound Energy)
- Difference: $42.19/month ($506/year)
Why Seattle Is Cheaper: Seattle City Light, a public utility, typically offers lower rates than Puget Sound Energy, the private utility serving much of the Eastside.
Parking and Transportation
Monthly Parking Costs:
- Seattle Downtown/South Lake Union: $156-$300+ (premium spots)
- Bellevue Downtown: ~$169 average
- Advantage: Bellevue (slightly lower, more availability)
Public Transit:
- Standardized across region via ORCA card
- Single ride: $3.00
- Monthly pass: $99
- No difference between regions
Commute Costs:
- Living in Seattle, working on Eastside: Bridge tolls ($2.50-$6.00 per crossing on SR 520)
- Living on Eastside, working in Seattle: Same bridge tolls apply
- Advantage: Live where you work to avoid tolls
Total Cost of Living Summary
For a $1,500,000 Home:
Seattle Annual Costs:
- Property taxes: $13,791
- Utilities (electricity): $1,010
- Parking (if needed): $1,872-$3,600
- Total: $16,673-$18,401
Bellevue Annual Costs:
- Property taxes: $12,757
- Utilities (electricity): $1,517
- Parking (if needed): $2,028
- Total: $16,302
Surprising Result: Despite higher home prices, Bellevue's ongoing costs are comparable to or slightly lower than Seattle's, primarily due to lower property tax rates. The main variable is parking, which can be significantly more expensive in Seattle's urban core.
Commute Analysis: Time Is Money
Living in Seattle, Working on Eastside
Capitol Hill to Microsoft (Redmond):
- Drive: 40-45 minutes (peak hours), highly variable
- Public transit: 45-60 minutes (Sound Transit 545 bus)
- Annual commute time: ~400-500 hours/year (assuming 3 days/week hybrid)
Capitol Hill to Meta (Bellevue):
- Drive: 25-35 minutes (peak hours)
- Public transit: 40-50 minutes
- Annual commute time: ~300-400 hours/year
Ballard to Google (Kirkland):
- Drive: 30-40 minutes (peak hours)
- Public transit: 50-70 minutes (requires transfers)
- Annual commute time: ~350-450 hours/year
Cost Considerations:
- SR 520 bridge toll: $2.50-$6.00 per crossing (varies by time and Good To Go! account)
- Annual toll cost (3 days/week): ~$780-$1,872
- Gas and vehicle wear
Living on Eastside, Working in Seattle
Redmond to Amazon (South Lake Union):
- Drive: 35-50 minutes (peak hours)
- Public transit: 45-60 minutes
- Annual commute time: ~400-500 hours/year
Bellevue to Amazon (South Lake Union):
- Drive: 25-40 minutes (peak hours)
- Public transit: 35-45 minutes
- Annual commute time: ~300-400 hours/year
Kirkland to Amazon (South Lake Union):
- Drive: 30-45 minutes (peak hours)
- Public transit: 40-55 minutes
- Annual commute time: ~350-450 hours/year
Living and Working on Same Side
Capitol Hill to Amazon (South Lake Union):
- Walk: 20-25 minutes
- Bike: 10-15 minutes
- Drive: 10-15 minutes (parking is the challenge)
- Public transit: 15-20 minutes
- Annual commute time: ~150-200 hours/year
Redmond to Microsoft:
- Drive: 5-15 minutes (depending on specific location)
- Bus: 7-20 minutes
- Bike: 15-25 minutes
- Annual commute time: ~100-150 hours/year
Kirkland to Google (Kirkland):
- Drive: 5-10 minutes
- Walk/Bike: 15-30 minutes (depending on neighborhood)
- Annual commute time: ~75-125 hours/year
Bellevue to Meta (Bellevue):
- Drive: 5-15 minutes
- Walk: 20-40 minutes (from downtown Bellevue)
- Annual commute time: ~100-150 hours/year
The Commute Cost Calculator
Value of Time: If you value your time at $50/hour (conservative for tech workers):
Cross-Lake Commute (400 hours/year):
- Time value: $20,000/year
- Bridge tolls: $1,000/year
- Gas and wear: $2,000/year
- Total annual cost: $23,000
Same-Side Commute (150 hours/year):
- Time value: $7,500/year
- No bridge tolls: $0
- Minimal gas: $500/year
- Total annual cost: $8,000
10-Year Difference: $150,000 in time value and direct costs
Critical Insight: The commute cost over 10 years can equal or exceed the price premium of living closer to work. A $200,000 higher home price on the Eastside may be financially justified if it eliminates a cross-lake commute to an Eastside employer.
For relocation guidance, read our complete relocation guide for moving from California to Washington for tech jobs.
Lifestyle and Amenities: Urban vs. Suburban
Seattle: Urban Energy and Cultural Vibrancy
Walkability:
- Average Walk Score: 74 (Very Walkable)
- Capitol Hill: 93 (Walker's Paradise)
- Ballard: 85 (Very Walkable)
- Fremont: 82 (Very Walkable)
Dining and Entertainment:
- Diverse restaurant scene (every cuisine imaginable)
- Independent coffee shops and cafes
- Live music venues and theaters
- Vibrant nightlife (especially Capitol Hill, Belltown)
- Farmers markets and food festivals
Cultural Attractions:
- Pike Place Market
- Seattle Art Museum
- Museum of Pop Culture (MoPOP)
- Seattle Symphony and Opera
- Numerous independent theaters and galleries
Outdoor Recreation:
- Urban parks (Discovery Park, Green Lake, Volunteer Park)
- Burke-Gilman Trail for cycling
- Waterfront access (Alki Beach, Golden Gardens)
- Kayaking and paddleboarding on Lake Union
Best For:
- Young professionals who thrive on urban energy
- Couples without children prioritizing culture and dining
- Those who value walkability and transit access
- People who want to minimize car dependency
Eastside: Suburban Tranquility and Family Focus
Walkability:
- Bellevue Downtown: Improving (mixed-use developments)
- Residential areas: Car-dependent (Walk Scores 40-60)
- Emphasis on driving and parking availability
Dining and Shopping:
- The Bellevue Collection (upscale shopping)
- High-end restaurants and chains
- More family-friendly dining options
- Less diversity than Seattle but growing
Parks and Recreation:
- Bellevue: "City in a Park" with 2,700+ acres of parks
- Marymoor Park (640 acres with dog park, climbing wall)
- Bridle Trails State Park (equestrian trails)
- Lake Sammamish State Park
- Extensive trail systems for hiking and biking
Family Amenities:
- Top-rated public libraries
- Community centers with programs
- Youth sports leagues and facilities
- Safe, quiet neighborhoods
Best For:
- Families with children prioritizing schools
- Those seeking space, yards, and privacy
- People who value safety and low crime rates
- Professionals working at Eastside tech companies
Crime and Safety Comparison
Seattle:
- Higher property crime rates (especially downtown)
- Visible homelessness in urban core
- Varies significantly by neighborhood
- Capitol Hill, Ballard generally safer than downtown
Eastside:
- Consistently lower crime rates across all categories
- Bellevue ranks among safest cities in Washington
- Less visible homelessness
- Strong sense of community safety
Data Point: Bellevue's violent crime rate is approximately 60% lower than Seattle's, and property crime is about 40% lower.
School Districts: The Decisive Factor for Families
Eastside School District Rankings (2025)
Top-Ranked Districts in Washington State:
-
Bellevue School District (BSD405)
- Ranking: #1 in Washington
- Students: ~20,000 across 30 schools
- Graduation rate: 95%+
- College readiness: Exceptional
- Notable schools: Newport High, Interlake High, Bellevue High (all 10/10 ratings)
-
Northshore School District
- Ranking: #2 in Washington
- Serves: Bothell, Woodinville, parts of Kenmore
- Strong STEM programs
- High college acceptance rates
-
Lake Washington School District
- Ranking: #3 in Washington
- Serves: Redmond, Kirkland, Sammamish
- Excellent technology integration
- Strong AP and IB programs
Elementary Schools (10/10 Ratings):
- Somerset Elementary (Bellevue)
- Newport Heights Elementary (Bellevue)
- Cherry Crest Elementary (Bellevue)
- Woodridge Elementary (Bellevue)
High Schools (10/10 College Success Ratings):
- Newport Senior High (Bellevue)
- Interlake Senior High (Bellevue)
- Bellevue High (Bellevue)
- All recipients of College Success Award
Seattle School District Performance
Seattle Public Schools:
- Ranking: Significantly lower than Eastside districts
- Challenges: Budget constraints, achievement gaps, enrollment decline
- Variability: Wide performance range between schools
Bright Spots:
- Some excellent elementary schools in affluent neighborhoods
- Strong option schools and magnet programs
- Garfield High School (historically strong)
Reality Check: Even Seattle's best public schools generally rank below average Eastside schools. Many Seattle families with means opt for private schools, adding $20,000-$40,000/year to education costs.
The School District Premium
Property Value Impact:
- Homes in top-rated school districts command 15-25% premium
- Faster appreciation in high-performing districts
- Easier resale when schools are excellent
Financial Calculation for Families:
Option 1: Eastside Home with Public Schools
- Home price: $1,600,000
- Annual property tax: $13,600
- School cost: $0 (public)
- Total annual housing + education: $13,600
Option 2: Seattle Home with Private School
- Home price: $985,000
- Annual property tax: $9,050
- Private school cost: $30,000/year (one child)
- Total annual housing + education: $39,050
Difference: $25,450/year in favor of Eastside public schools
Over 12 years (K-12): $305,400 savings by choosing Eastside
Conclusion: For families with children, the Eastside's higher home prices are often offset by the value of top-tier public schools, making it financially competitive with or superior to Seattle + private school.
Decision Framework: Which Side Is Right for You?
Choose Seattle If:
✅ You work at Amazon, Zillow, Expedia, or other Seattle-based tech companies
✅ You're single or a couple without children (or children are grown)
✅ You value urban lifestyle, walkability, and cultural amenities
✅ You want diverse dining, nightlife, and entertainment options
✅ You prefer condos or townhomes over single-family homes
✅ You have a lower budget ($600,000-$1,000,000)
✅ You want to minimize car dependency
✅ You're comfortable with higher urban density and activity
✅ You plan to use private schools if you have children
Best Seattle Neighborhoods for Tech Workers:
- Capitol Hill: Urban living, walkable, Link light rail access
- Fremont: Quirky, artistic, good restaurants, more residential feel
- Ballard: Waterfront, breweries, Scandinavian heritage, family-friendly
- Wallingford: Quiet residential, good schools for Seattle, family-oriented
- Queen Anne: Views, proximity to downtown, mix of urban and residential
Choose Eastside If:
✅ You work at Microsoft, Google, Meta, T-Mobile, or other Eastside companies
✅ You have children or plan to start a family
✅ Top-rated public schools are a priority
✅ You value safety, low crime, and quiet neighborhoods
✅ You want a single-family home with a yard
✅ You prefer suburban lifestyle and car-oriented living
✅ You have a higher budget ($1,200,000+)
✅ You prioritize newer construction and modern amenities
✅ You want strong property appreciation potential
✅ You value proximity to outdoor recreation (hiking, parks)
Best Eastside Cities for Tech Workers:
- Redmond: Microsoft proximity, family-friendly, good value for Eastside
- Kirkland: Waterfront, downtown walkability, Google offices, charming
- Bellevue: Premium option, best schools, urban amenities, corporate hub
- Sammamish: Top schools, large lots, family-oriented, more affordable than Bellevue
- Issaquah: Outdoor recreation, hiking access, most affordable Eastside option
Hybrid Strategy: Best of Both Worlds
Some tech workers successfully split the difference:
Live in North Seattle, Work on Eastside:
- Neighborhoods: Northgate, Lake City, Wedgwood
- Shorter commute to Eastside than central Seattle
- More affordable than Eastside
- Access to Seattle amenities
Live in South Bellevue/Newcastle, Work in Seattle:
- Shorter commute to Seattle than north Eastside
- Eastside school districts
- Slightly more affordable than central Bellevue
For neighborhood comparisons, explore our analysis of Kirkland vs. Bothell family-friendly neighborhoods.
Financial Analysis: Total Cost of Ownership
10-Year Ownership Comparison
Scenario: Tech Employee with $300,000 Down Payment
Seattle Option: $1,000,000 Home in Ballard
- Down payment: $300,000
- Mortgage: $700,000 at 6.5% = $4,422/month
- Property tax: $9,194/year = $766/month
- Insurance: $150/month
- Utilities: $200/month
- Maintenance: $300/month
- Total monthly: $5,838
- 10-year total: $700,560
- Appreciation (2%/year): $218,994
- Net cost: $481,566
Eastside Option: $1,600,000 Home in Redmond
- Down payment: $300,000
- Mortgage: $1,300,000 at 6.5% = $8,213/month
- Property tax: $13,600/year = $1,133/month
- Insurance: $200/month
- Utilities: $250/month
- Maintenance: $400/month
- Total monthly: $10,196
- 10-year total: $1,223,520
- Appreciation (4%/year): $704,122
- Net cost: $519,398
Add Commute Costs (if working on opposite side):
- Seattle resident, Eastside job: +$150,000 (10 years)
- Eastside resident, Seattle job: +$150,000 (10 years)
Add School Costs (if applicable):
- Seattle with private school: +$360,000 (12 years, one child)
- Eastside with public school: $0
The Verdict: It Depends on Your Situation
For Singles/Couples Without Children Working in Seattle:
- Winner: Seattle (lower total cost, better lifestyle fit, no commute penalty)
For Singles/Couples Without Children Working on Eastside:
- Winner: Eastside (no commute penalty, better appreciation, comparable net cost)
For Families with Children Working on Eastside:
- Winner: Eastside (school savings, no commute, appreciation, lifestyle fit)
For Families with Children Working in Seattle:
- Toss-up: Seattle saves on home price but costs more for schools; Eastside costs more upfront but saves on schools and offers better appreciation
Expert Recommendations for Tech Workers
Maximize Your Tech Compensation
Use RSUs for Qualification:
- Work with lenders who understand tech compensation
- Document 2+ years of RSU vesting history
- Lenders typically count 75% of RSU value
- Can increase borrowing power by $100,000-$150,000
Time Your Purchase:
- Align with major RSU vesting dates
- Use ESPP accumulation for down payment
- Consider bonus timing for closing costs
For detailed strategies, read our guide on RSUs and stock options for down payments.
Leverage Down Payment Assistance
Washington State Programs:
- Home Advantage Program (income under $180,000)
- Opportunity DPA (up to $15,000)
- City of Seattle DPA (up to $45,000)
- ARCH program for Eastside (up to $30,000)
Consider Future Flexibility
Job Changes:
- Tech workers change companies every 2-4 years on average
- Choose location that works for multiple employers
- Eastside provides access to Microsoft, Google, Meta, T-Mobile
- Seattle provides access to Amazon, Zillow, Expedia, F5
Remote Work Policies:
- Don't assume current flexibility will continue
- Amazon's 5-day RTO shows trend toward office presence
- Buy where you can commute if policy changes
Think Long-Term Appreciation
Best Appreciation Potential:
- Bellevue (5-7% projected)
- Redmond (4-5% projected)
- Kirkland (4-5% projected)
- Seattle premium neighborhoods (3-4% projected)
- Seattle average (2-3% projected)
Factors Supporting Eastside Appreciation:
- Limited inventory and land constraints
- Continued tech company expansion
- School district demand
- Wealthy buyer pool
Take the Next Step: Work With a Specialist
Choosing between Seattle and the Eastside is one of the most significant financial and lifestyle decisions you'll make as a tech professional. The right choice depends on your unique situation: your employer location, family status, budget, lifestyle preferences, and long-term goals.
Why Work With a Tech-Specialized Real Estate Agent?
As a real estate professional specializing in serving tech employees throughout the Seattle and Eastside areas, I provide:
Market Expertise:
- Deep knowledge of both Seattle and Eastside markets
- Access to off-market listings and coming-soon properties
- Accurate pricing guidance based on recent comparables
- Neighborhood insights beyond what you'll find online
Tech Compensation Expertise:
- Connections with lenders who understand RSU income
- Strategies for maximizing your borrowing power
- Timing guidance around vesting schedules
- Down payment assistance program navigation
Negotiation Skills:
- Winning strategies in multiple-offer situations
- Protection of your interests while staying competitive
- Experience with escalation clauses and contingencies
- Track record of successful closings in both markets
Service Areas
Seattle Neighborhoods: Capitol Hill, Fremont, Wallingford, Ballard, Queen Anne, Green Lake, University District, Magnolia
Eastside Cities: Bellevue, Redmond, Kirkland, Sammamish, Issaquah, Newcastle, Woodinville
Contact Peter J Kim Today
Ready to explore your options in both Seattle and the Eastside? Let's discuss your specific situation and find the perfect home for your needs.
Peter J Kim
Tech Employee Real Estate Specialist
📧 Email: [email protected]
📱 Phone: 425-409-3823
Free Consultation Includes:
- Personalized Seattle vs. Eastside analysis for your situation
- Neighborhood tours in both regions
- Comparative market analysis
- Mortgage pre-approval guidance with tech-savvy lenders
- Long-term financial projections for each option
Success Stories
I've helped hundreds of tech employees make the Seattle vs. Eastside decision:
- Microsoft engineers finding the perfect Redmond home within walking distance of campus
- Amazon employees discovering Capitol Hill condos that maximize urban lifestyle
- Google families relocating to Kirkland for schools and waterfront living
- Meta product managers choosing between Bellevue luxury and Seattle character
Don't make this decision alone. Contact me today for expert guidance tailored to tech employees.
This analysis is based on comprehensive research of Seattle and Eastside real estate markets, including price data, market trends, and lifestyle factors current as of March 2026. Market conditions can change, so it's important to work with a knowledgeable professional who stays current with the latest data.
Additional Resources: